
Creating Competitive Advantage
through Investing in Human Capital
at Van Dorn Demag
ABOUT
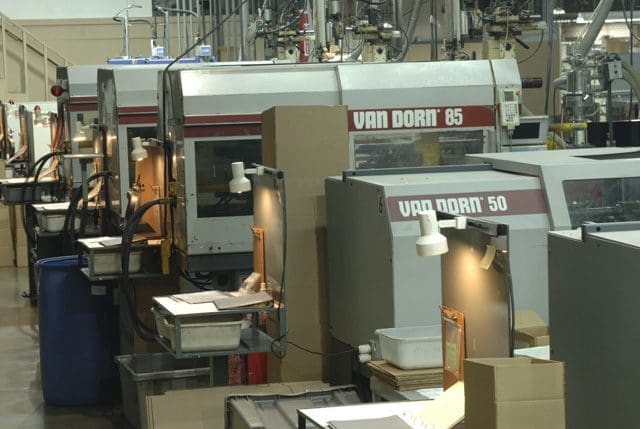
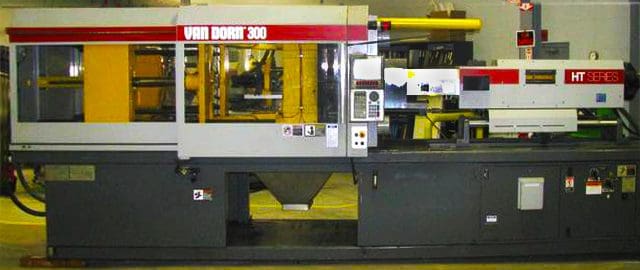
Van Dorn Demag Corporation designs, manufactures, sells, and services injection molding machinery in North America. 1999 sales were $210 million. Year-end employment was 774 people comprised of 367 hourly wage earners and 407 salaried wage earners. The company operates 5 facilities in Ohio and South Carolina with headquarters in Strongsville, Ohio.
The company began building injection-molding machinery in Cleveland in 1946 as a division of the Van Dorn Company, a mid-sized public company with additional divisions in the metal container business. It grew slowly but steadily through the 1970s as a leader in the industry within the United States. Several European manufacturers also entered the US market during this time, as much of the technology was developed in Europe.
In the early 1980s, several Japanese manufacturers entered the US market, offering standardized machines at attractive prices. Their success led to a dramatic shrinkage in the number of US manufacturers and significant changes within those companies that continued to compete. With a few exceptions, the European manufacturers withdrew from the market. This decision was influenced as much by the weakness of the US dollar against European currencies as by the declining profits of the industry.
The Van Dorn Plastic Machinery division endured significant changes during the late 1980s, including a major new product introduction, two plant closings and consolidations and senior management changes. Sales peaked at $120 million in 1984 and then declined to around $95 million by 1992. Profits exhibited the same pattern.
Van Dorn Corporation was approached at several points during this time period by a German machinery manufacturer with offers to buy all or a portion of the machinery division. After a protracted hostile takeover battle, a three-way deal was consummated between Mannesmann Demag, Van Dorn Company and Crown Cork & Seal Company that passed ownership of the machinery division to Mannesmann Demag.
The company’s objectives have been consistent since before the acquisition by Demag – to improve quality, to reduce cost and to gain market share. It is within this context that the company began looking for training materials to enhance the concept of associate ownership of results.
The Situation
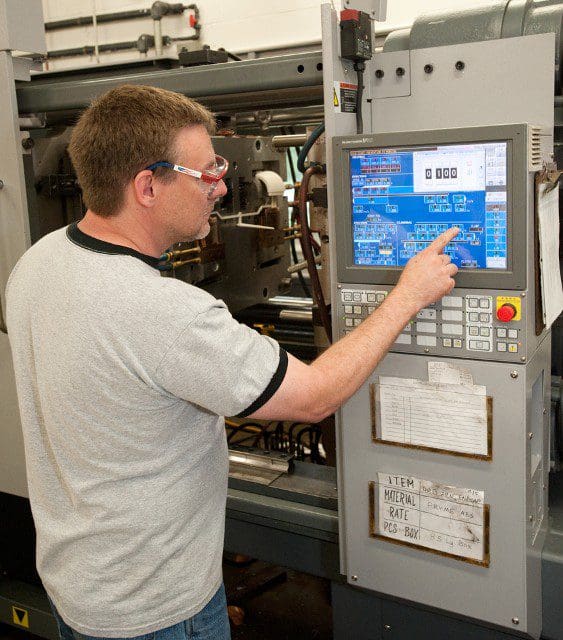
In 1996, the Strongsville, Ohio facility experienced a union organizing drive that was eventually soundly defeated. [For a six-month period in 1994, a union was recognized at the Strongsville facility as part of a ruling handed down by the National Labor Relations Board relating to events from the mid-1980s at another plant that had been closed. The facility had always been a non-union work environment. The union was de-certified by the associates as soon as it was legally possible.] Out of the process of evaluating the employee-management environment that led up to the organizing drive, a recommendation was made to improve the managerial skills of first line supervisors.
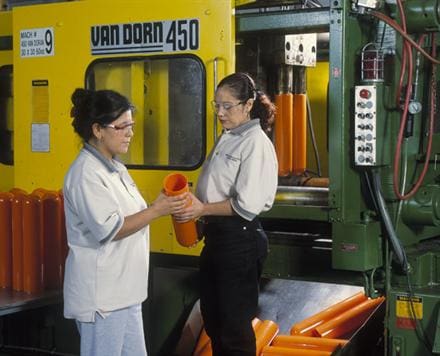
As a result, a team was established in the Fall of 1996 to identify the next level of training required to address managerial skills. 1997 marked the tenth year of a cultural change process that included programs such as Total Quality Management, Quality Action Teams, ODI (Organizational Dynamics, Inc.) Managing for Productivity™ Supervisor Training and the implementation of an Associate Skills/Pay for Knowledge Program. During the initial team meetings, the team noted that a primary key to achieving the goal was to get the Management, Salary and Hourly staffs aligned and prepared to take on new challenges. After a careful examination of the Company’s Strategic Plan, the cultural climate and associate soft skill needs, a matrix was created identifying the “wants and needs” for a formal training process.
The Process for Selecting a Consulting Partner and Methodology
The team analyzed potential training suppliers, compiling a list of consultants including those Van Dorn had worked with before and those who were recommended by other companies. The team pared this list down to four companies who were invited to make presentations about their organization, their resources and their thoughts about helping Van Dorn attain its vision.
After the presentations, individual team members assessed each Supplier’s ability and compatibility on 10 key issues. Each issue could be given a score of 1 to 5, with 5 being the highest. These key factors were as follows:
• Process for understanding & incorporating our culture/needs
• Philosophy & model match with Van Dorn Demag Corp.
• Prescribing appropriate training
• Training approach (canned, customized..)
• Leadership/supervisory training deliverables
• Ownership/empowerment training deliverables
• Ability to Facilitate Training
• Ability to help create energy & rally the organization
• Tools provided /instruction for follow-up
• Investment value
The total scores for each Supplier were then reviewed. Open discussion ensued focusing on the training strategy and tools each company would employ to meet the Company’s expectations. This training would involve every associate employees of VDD, at 5 different locations in Ohio and South Carolina, plus the Field Service Technicians scattered throughout North America. The importance of the supplier capability to send the same message across these boundaries was paramount.
The team recommended Catalyst Consulting Group, Inc. represented by their President Leslie A.Yerkes. A customized five phase, two-year competency development process was outlined. The process included methodologies developed by Training House to provide VDD with a replicable solution that mirrored the competency model established by the selection team. The solution began with assessments, both subjective and objective, followed by skills development and concluding with post-assessment for both individuals in supervisory positions and the general associate population.
The DECIDE Process
A formal Steering Group was established to work with Leslie. The purpose of the Steering Group was to guide and champion the process. The endeavor was designed to be systemic and viewed not as a quick fix but a long term, sustainable, developmental process to increase the competency of all associates in pursuit of becoming a high-performance organization. Sub teams were developed to support the effort:
Communication to always let associates know what is going on with DECIDE;
Measurement to establish measures and continuous improvement targets for leaders, associates and the company;
Transfer of Training to think of ways to help you apply what has been learned to your job;
Volunteers to help spread the word of DECIDE;
Recognition to reward associates that support the DECIDE process.
Over the course of two years the organization invested approximately $487 per associate employee averaging between 56 and 72 hours of assessment and direct skill development. All assessment results were provided directly to the participants and although it was not required, they were encouraged to share results with their supervisors and others in their workgroup.
Key Measures
The organization is QS9000-TE Supplement certified and has established extensive measures of performance relative to Cost, Quality and Market Share. A sample of these measures consists of:
Quality – product reliability expressed as a percentage of components working through the 2 year warranty period without failure
Waste – the “Cost of Quality” internal and external failure costs as a percent of sales
Costs – the relative change in product cost from one period to the next
Profitability – the return on gross operating assets
Market Share – the percentage of US dollars booked as compared to the industry0
Focus Groups
A representative group voluntarily participated in a focus group process to clarify the key issues contributing to a low perception of management credibility as indicated on the survey. Focus group participants worked through a facilitated process to formulate a set of recommendations that were presented to the steering team and senior management. Their recommendations were adopted and put into action through the creation of a scorecard.
Key factors that were indicators of low management credibility scores are detailed on a scorecard. Data for each category is presented and monitored at quarterly DECIDE Steering Group meetings. For example, the amount of on time Performance Planning and Management reviews (PP&M’s) was very low. Currently, the percentage of on time PP&M’s increased from 18% to 78%. The scorecard assists in monitoring current standings against our goals and other development opportunities for such categories.
In October of 1997 the journey began with:
• Piloting of the MAP (Managerial Assessment of Proficiency) and a 360 degree feedback tool (Perspectives) for individuals in supervisory positions and ACT (Assessment of Competencies) for associates;
• The roll-out began with an orientation for all supervisors (from team leader to CEO) to the “Role of the Supervisor”
• Each individual then participated in the two-day Managerial Assessment of Proficiency assessment and interpretation process. Each was expected to complete an Individual Development Plan by the end of their coursework, including the post-assessment
• Mentors were assigned to each MAP participant
• Van Dorn Demag decided that all individuals in supervisory positions had to participate in all twelve of the EXCEL skill-building models to provide a common language and competency framework. The modules were offered over the course of 12 months.
• As the supervisory personnel completed their MAP, the associates were introduced to ACT (Assessment of Competencies)o
The organization, however, lacked a measure for employee satisfaction. The Survey of Organizational Climate by Training House was selected for its ease of administration, price and indicators. The Survey of Organizational Climate measures 12 indicators:
Clarity of Goals
Job Interest and Challenge
Rewards and Satisfactions
Standards of Excellence
Degree of Responsibility
Personal Development
Working Relationships
Advancement Mobility
Job Security
Management Credibility
Personnel Policies and Procedures
Self-Confidence {scale = 0 (low) to 15 (high)}
The Impact
Key Outcomes / Company Performance
The organization targeted to raise the “Proficiency Composite” on MAP from 55%ile to 66%ile (an increase of 20%).
In November 1997, February 1998, and May 1999, 98 individuals in supervisory positions from all five Van Dorn DEMAG locations participated in the pre-assessment phase of the DECIDE process. This pre-assessment phase consisted of the Managerial Assessment of Proficiencies (MAP) and a 360&Mac176; feedback tool called Perspectives. Each individual received objective (MAP) and subjective (Perspectives) feedback on twelve core managerial competencies of management and their personality and communication style.
In June and October 1999, after completing the skill-building training devoted to each of the twelve core managerial competencies, 63 individuals participated in the post- assessment phase of the DECIDE process. Individuals who had completed all twelve sessions were eligible for the MAP and Perspectives post-assessment.
• The entire associate group participated in a two-part assessment and interpretation process to provide them feedback on 12 core competencies, personality style and communication style
• Supervisors were encouraged to coach and facilitate discussions within their work groups to support the design of individual development plans and foster an understanding of individual strength, opportunities for development and style preferences
• All associates registered for the skill building models entitled TEAMS
• The southern region and field service personnel were folded into the process fully participating in MAP/EXCEL and ACT/TEAM offerings. Each location was enabled to proceed at its own pace utilizing the “footprint” of each model
• The process was evaluated at each phase: assessment, skill sessions, application and finally post-assessment
• The process was fluid and flexible. As feedback was received the Steering Group adjusted the plan to achieve the best results and engage the full participation of all associates
• As the process evolved the Steering Group discussed how to realign the performance management systems to the performance orientation and ownership cultivated by the process
The climate is the perceptions, feelings, and expectations that people have about their employer and the place they work.
Scoring
0 – 5 an area for development
6 – 10 moderate
11 – 15 as a relative strength.
The results of the survey were fully disclosed and discussed with all employees.
The survey reinforced previously gathered qualitative data and provided a baseline for future “temperature” takings. Van Dorn Demag selected management credibility, the lowest scored category, to focus on as an area for development.
o
o
o
o
o
Quantitative Summary
55 scores increased = 74% of group
Average increase = 40.36 percentile points
Greatest increase = 56 percentile points
8 scores decreased = 11% of group
Average decrease = 9.2 percentile points
Greatest decrease = 19 percentile points
Most individuals increased scores in their lowest area
The original MAP Proficiency Composite for 98 individuals was 55%
This increase of 19 percentile points is an impressive 35% gain
The perspectives data is less helpful as a group comparison.
The original composite for individual, front line manager, and 5 associates was within 5 percentile points of each other ranging between 68%ile and 73%ile. The post assessment Perspectives composite for individual, front line manager, and 5 associates was within 6 percentile points of each other ranging between the 70 and 76th percentiles.
X and Y
The pre assessment ratio was: 56 X | 60 Y
The post assessment ratio was: 39 X | 70 Y
Personality
The personality score remained constant, as anticipated

The Current State
As of this writing, the venture continues as the Human Resource Development Department (HRD) continues the process of supervisory development utilizing MAP and EXCEL. A major share of our Managers and Supervisors have completed MAP training. The remaining supervisors/managers are still engaged in the supervisory training as it continues to be a mandatory effort. The ACT pre-assessment is also still administered to every incoming associate. For TEAMS, the associates can request skill segments “on demand” based on their team need, individual growth efforts or business challenges. In addition to “on demand” needs, a TEAMS module is rolled-out every month and is offered to all associates at every level and shift. We have a full course catalog outlining the offered training.
Facilitation and training roles are also now done entirely in-house. The Manager of the Human Resource Development department administers all assessments, pre and post. The Manager of HRD and the Associate Involvement Coordinator serve as Trainers for the EXCEL modules and champions the TEAMS modules. Train the Trainer sessions have taken place and internal trainers, both recommended and volunteers, are each assigned one module to be “expert” in training. They are additionally called upon for assistance by the HRD department for individual team requests of a particular module.
The actual modules have also been revisited to customize the material in order to align with our own company’s goals, objectives and our particular industry. The HRD department reads through the module initially and does pre-work for “Van-Dornizing” the module. The original cross-departmental DECIDE Transfer of Training Team is then called together and gives their own suggestions based on their department’s needs. Finally, the HRD associates meet with the TEAMS trainers and they finalize the information to be presented within the course. Evaluations show that this type of training is more inclusive of our associate’s needs and our company’s culture.
On Going Activities
At the beginning of the process it was understood that hallmarks of the process effectiveness would include:
A decreased involvement of the external consultant
The adoption of a framework for consistently developing individual competency
An increased ownership and involvement of associates in the process
A decrease of resistance to developmental efforts
An increase in competency, improved relationships and results
Lessons Learned
During the process of training many groups and evaluating interim results, the Steering Group came to numerous realizations that influenced the remaining course of events. The main lessons can be summarized as follows:
• The importance of clear communication up, down and across the organization cannot be underestimated
• Even though management understood the strategic direction of the company, more discussion was necessary with the bulk of the organization (including supervision)
• Follow through is difficult to obtain and enforce within our culture [The mentorship commitment was not carried out through the whole DECIDE process]
• An orientation to measurable financial results should be the focus of any training or team activity – competency training without the team-based, results-focused project driver was not as useful or effective [In fact, the entire ACT/TEAMS approach was changed from a pro-active to re-active basis. Training is now given on request to an individual or team, based upon their evaluation of need to accomplish their project goals]
• Changes in attitudes occur subtly and in pockets, not uniformly and is gained and lost on a daily basis.
“Our job is not complete – in fact we have not achieved all that we hoped through this process. It turns out changing a long-standing culture takes lots of hard work and commitment from the very top of the organization. I think that the most important and lasting legacy is the realization that we can achieve more than we thought possible by encouraging and harnessing the capability we have within Van Dorn Demag.”
Jeffrey D. Schad
Vice President, Finance
| Pre-Training and Post-Training MAP Scores | ||||
| Pre | Post | % Change | ||
| Administration | Time Management & Prioritizing | 52 | 72 | 38% |
| Setting Goals & Standards | 51 | 72 | 41% | |
| Planning & Scheduling Work | 60 | 69 | 15% | |
| Administrative Composite | 54 | 71 | 34% | |
| Communication | Listening & Organizing | 50 | 68 | 36% |
| Giving Clear Information | 54 | 77 | 43% | |
| Getting Unbiased Information | 60 | 76 | 27% | |
| Communication Composite | 55 | 73 | 33% | |
| Supervisory | Training, Coaching, Delegating | 53 | 57 | 8% |
| Appraising People & Performance | 58 | 70 | 21% | |
| Disciplining & Counseling | 58 | 78 | 34% | |
| Supervisory Composite | 56 | 68 | 21% | |
| Cognitive | Identifying & Solving Problems | 53 | 76 | 43% |
| Making Decisions, Weighing Risk | 59 | 69 | 17% | |
| Thinking Clearly & Analytically | 50 | 65 | 30% | |
| Cognitive Composite | 54 | 70 | 30% | |
| Total | PROFICIENCY COMPOSITE | 55 | 71 | 29% |
| Styles | Theory X (Parent-Child) | 52 | 43 | -17% |
| Theory Y (Adult-Adult) | 61 | 70 | 15% | |
| Interactions | Empathic | 14 | 15 | |
| Critical | 8 | 8 | ||
| Searching | 17 | 20 | ||
| Advising | 20 | 17 |

Case contributors
Jeffrey Schad | Vice President Finance & Accounting
oooooooooooiooVan Dorn Demag Corp.
Jennifer Irwin | Manager Human Resource Development
oooooooooiiooooVan Dorn Demag Corp.
John Stack | Manufacturing Manager
oooooooiooooooVan Dorn Demag Corp.
Leslie Yerkes | President
ooooooooioooooCatalyst Consulting Group, Inc.
 Our goal is to exceed your expectations. In the unlikely event you feel that the gains are not commensurate with the time and resources expended, we will continue the project at no further cost until you are completely satisfied. We offer this guarantee because we don’t want you to worry about our work when you have real issues with which to contend.

